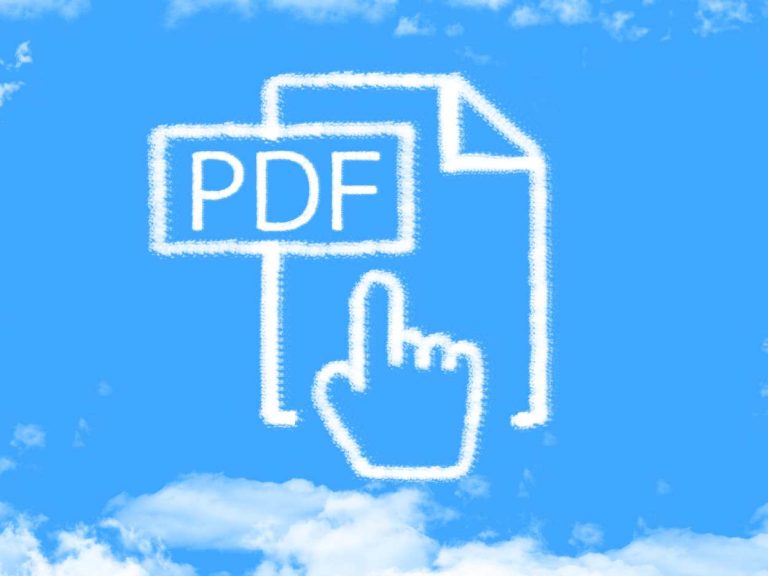
Search :
 Software Categories
AntiVirus
Audio & Video
Business/Organize
Desktop Enhancements
Developer Tools
Drivers
Games  Hot!
Graphics/Design
Home & Education
Internet
Network
Programming
Screensavers
Security/Privacy  Hot!
Utilities
Sponsors
Site Links
New Releases
Top 100
File Bar
RSS Feeds
Free Tech Magazines
News/Articles
Submit Software
Link to Us
Partners
Resources
Check Your PC for Errors
FreewareFiles Express delivers the
Hottest Downloads right to your Inbox! Sign up Now!

Next Issue: 05-25-2012

Top Graphics Top Business Weekly Polls Download Manager FileBar Driver Scan
Top Games Top Security Top Audio/Video Top Desktop Top Utilities Top Internet Tools Top Game Sites
Changelog:

What's New in version 3.6.3:

  • Animation didn’t work as expected if AxisLabels for axis was set from managed-code in WPF.
  • Chart threw exception while saving chart as image at server-side under background-thread using ASP.net.
  • Visifire Chart control and it’s elements were focusable as TabStop property was not set to false for all elements of chart except Chart.

What's New in version 3.6.2:

  • Bugfix: Chart threw exception if Path property of DataMapping element was set to null while DataBinding.
  • Bugfix: Chart threw exception if XValue property of DataPoint, AxisMaximum and AxisMinimum properties of Axis were set as exponential value.
  • Bugfix: DataSampling was not working as expected if negative XValues were set in DataPoints.

What's New in version 3.5.7:

  • In Line, StepLine and Spline charts, markers were disappearing while zooming and updating DataPoints simultaneously at realtime.
  • If the FontSize of AxisLabels for Secondary AxisY was set to an odd value, AxisLabels were clipping.
  • In Polar chart if any DataPoint’s YValue was set to NaN, it was considered as zero internally.
  • Opacity property was not working as expected for DataSeries and DataPoint if set through property binding.
  • If there was single DataPoint in chart and YValue property for that DataPoint was set to a decimal value, AxisMaximum was not getting generated properly.

What´s New in version 3.5.6:

  • AnimationEnabled property has been introduced in ChartGrid class. One can easily enable or disable the initial animation for Grids. Also, this release contains fix for the following bugs:
  • ViewportRangeEnabled property for secondary y-axis was not behaving as expected.
  • Color property threw exception while DataMapping.
  • Axis was not updated if a DataPoint was removed at real-time.
       
 
PARTNERS CATEGORIES FREEWARE FILES